Month two flatters you, because discovery diners order big
With no history, period-over-period metrics are unavailable. Compare servers to each other, tickets to each other, and theoretical cost to actual instead.

Everything written about restaurant metrics — including what I've written — quietly assumes you have a past. Food cost this period versus last. Labor against forecast. Same-store sales. Prime cost against a benchmark.
A restaurant in week three has none of that. No prior period, no forecast worth the name, and benchmarks that describe mature businesses. So the standard dashboard is either unusable or, worse, usable and misleading.
There is a way to measure a business with no history, and it comes from changing the axis of comparison.
Compare across, not back
Time-series comparison needs history. Cross-sectional comparison doesn't. In week three you can't compare this Tuesday to last Tuesday, but you can compare:
- server to server, on the same shift, with the same menu
- ticket to ticket, as a distribution rather than an average
- station to station, on time-to-fire
- what a dish should have cost to what it did cost, because you compute both yourself
Every one of those is available on day one, and each of them detects a real problem. This is the entire measurement strategy for the first quarter. Everything else can wait until you have a past.
The four that work immediately
Comps, voids and discounts by server. This is the single most useful number a new restaurant can produce, because it needs no baseline at all — only a peer group.
Don't chase an industry percentage. Concept, price point and service style move the number too much for a published figure to mean anything, and I'd apply the same skepticism here I applied to the prime cost benchmark that turned out to have no traceable study behind it.
Instead, run exception reporting. Start deliberately loose — say around ten percent of a check's value removed through voids, comps and discounts — and look at who sits consistently above the pack. The threshold is arbitrary. The ranking is not, and the ranking is the signal. Tighten as you learn your own normal.
Two mechanics to set up before you open, because retrofitting them is harder: require manager approval for voids and comps, and mandate a reason code on every one. Without reason codes you have a number you can't investigate. The fraud patterns this surfaces are in the theft and POS fraud post.
Ticket time as a distribution. Covered in the soft opening post, and it stays the right measure for the whole first quarter. The average hides the tail, and the tail is what guests remember.
Theoretical versus actual food cost. The one financial metric that is fully self-contained: you know what the recipe should cost, you know what you spent, and the gap is real regardless of whether you have a prior period. Some variance is inherent — trim, cooking loss, imperfect portioning — so the goal is a variance you can explain, not zero. The method is in the food cost post.
Cash position and weeks of runway. Not a ratio, not a percentage — a dollar figure and a date. In the first quarter this is the number that determines whether the business survives, and it's the one most first-timers look at least often because it isn't on any KPI list. The cash flow post covers the mechanics; the discipline is to compute it weekly and write it down.
The trap: month two is not your business
Here's the thing I'd most want a new operator to internalize, because the mistake is invisible while you're making it.
Your early traffic is discovery diners — people who came because you're new. They order generously, they order the interesting thing, they tip well, and they don't ask many questions. As the novelty fades and the press cycle moves on, the mix shifts toward regulars and value-seekers, who order more carefully and respond to price.
The measurable consequence: average ticket declines even if you do nothing wrong. Your month-two check average is not a baseline. It is the top of a curve.
And it compounds with the calendar. Year one is the honeymoon; year two is the bill. Full rent arrives when the free-rent period expires, equipment starts failing on real usage rather than warranty, and the opening capital reserve is gone. That combination — declining novelty, full rent, first repairs, no cushion — is why failures cluster later than people expect rather than in the first months.
Two practical rules follow:
Never extrapolate from month two. Not for staffing, not for ordering, not for a forecast you show anyone. If you must model, model the ticket average down.
Know your rent commencement date and your reserve balance on the same page. The permitting post explains why that date is often earlier than operators expect, and it is the single largest step-change in your cost structure.
What you can start building toward
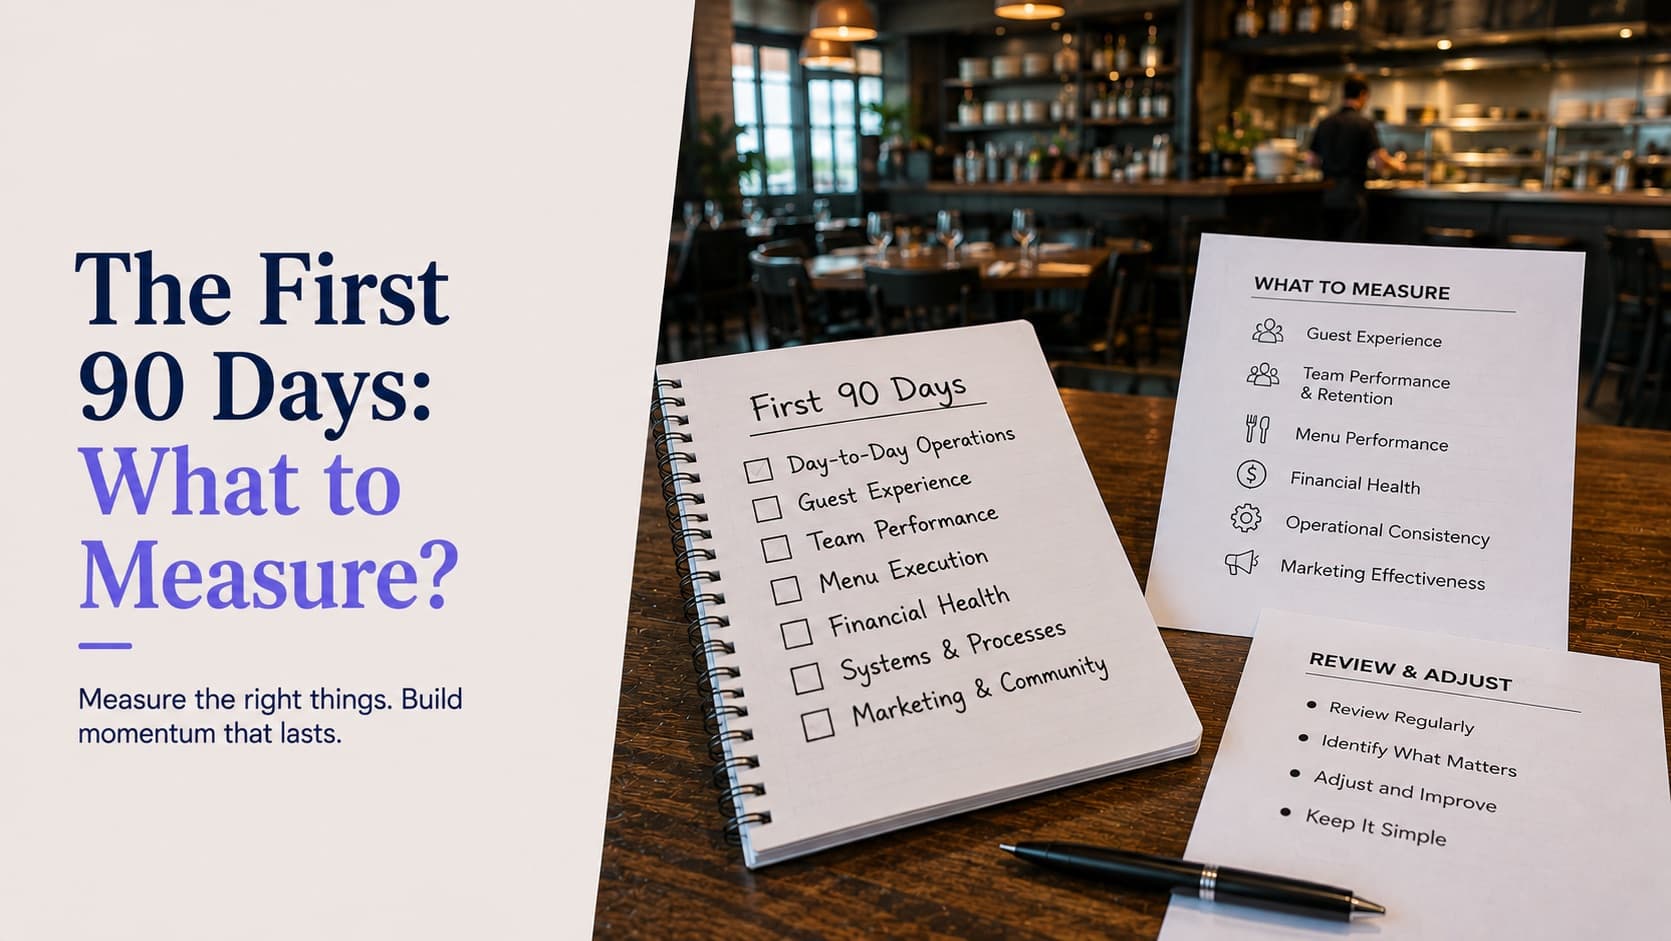
You're not permanently without history — you're accumulating it. Three things to set up now so the data is usable when you have enough of it:
Category discipline in the POS from day one. If items are mis-categorized in week one, your first six months of mix data is noise, and you'll be re-pricing off it. This is the same configuration that determines sales tax correctness and, in some states, your liquor license compliance ratio.
A weekly close, not a monthly one. Restaurants run on weeks. Closing weekly gives you thirteen data points by the end of the quarter instead of three, which is the difference between having a trend and having an anecdote.
Write down what you changed and when. Menu changes, price changes, staffing changes, hours. In three months you will want to know why a number moved, and without a change log you'll be guessing. This costs one shared document and is the highest-return thing on this list.
What I'm not going to give you
A first-90-days benchmark set. There isn't a credible one. Benchmarks are computed from operating restaurants, and a restaurant in month one is not one of those in any meaningful sense.
A break-even timeline. It's a function of your rent, your debt service and your ramp, all of which are specific to you. Compute it from your own numbers; don't compare it to anyone's.
A failure-rate statistic. I went through the provenance of the common ones in the cost-to-open post and they don't survive checking. What is well supported is the structural pattern above: the risk concentrates when novelty decays and rent goes full at the same time.
The whole thing in one paragraph
For the first quarter, ignore benchmarks. Rank your servers against each other on comps and voids with reason codes attached. Watch ticket time as a distribution and fix the tail. Compare theoretical to actual food cost and explain the gap. Compute cash runway weekly in dollars and dates. Close weekly, keep a change log, and treat every number from month two as the best it will ever look.
Disclosure: I work at Katalyst, and everything above is easier with a POS that does exception reporting by employee and reports ticket times as distributions — which we sell, so discount accordingly. The two items with the highest return here need no system at all: the weekly cash runway figure, and the change log.
Related Katalyst products
Topics
See how Katalyst handles your service style
A 30-minute walkthrough of the platform, tuned to how your restaurant actually runs.